

CFD visualization is the core of my job. And there are so many examples around. So let me share a little how-to today. A quest guide to post processing. A thought process documentation.
Starting with a standard view for your CFD visualization. First, you have to agree on the kind of information you want to transfer. What are you interested in? What quantity shows the core of the simulation?
- For a steady-state single phase flow, pressure and velocity might be the way to go. Maybe an iso-surface, showing where the coefficient of pressure equals zero – or total pressure coefficient in cross section?
- Dealing with conjugate heat transfer, solar radiation, cabin comfort? Heat and temperature are the quantities of your choice.
- Heavily unsteady phenomena, complex turbulence models, LES, IDDES? Show it. How about Q-criterion, vorticity, helicity?
- Multiphase flows? You need to show where one phase ends and the other begins. Free liquid surfaces, volume fractions etc.
But this time, your use case is the climate wind tunnel for a train. As this is a steady state simulation and you’re not yet inspecting temperatures, pressure shall be the quantity to look at.
You open up your scene, you create a first plane section in the middle of your domain. Drag-and-drop this derived part into the empty scene, select your pressure and… enjoy the view.
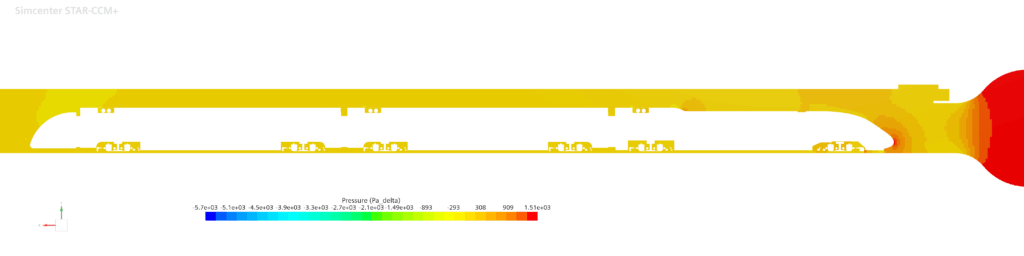
Well, as you can see, you can’t see anything. Or at least: this picture does show the whole domain – but the information you can are close to useless. A plus point for you, unlike the typical CFD visualization – this is image is not 80% green.
Why are all CFD visualizations green?
Doing the steps above, in a lot of cases you end up with a CFD visualization that is mostly green. The reason lies in the auto-setup.
You chose a part and a quantity to be displayed upon.
Your software looks for the maximum and the minimum of said quantity. These limits define the end of your scale. How else should the software know that these are not the limits you are looking for?

In this picture, you already messed around with the number of labels and increased them so much, that you can hardly read which number belongs to which position. But the importance is: two extreme points define your whole scale. And I personally have never seen a simulation where scalar values are distributed evenly over the domain. Most likely, few points show the extremes, and most values lie in the middle. Or better: in the indistinguishable mid of the colormap.
But that alone is not enough to make your potentially great CFD visualization green. It needs another poor choice. Once upon a time, engineers said:
“oh nice, we have that color coding RGB, let’s just use every fully saturated color from 100% blue over 100% green to 100% red.”
(some software engineer, not mechanical engineers! That’s very important to my ego!)
Combining a green middle with a centered majority of values delivers a CFD visualization that’s mostly green. Lucky you, your train is a little offset to the right, so your CFD visualization is yellow. Nevertheless, you cannot read information from that.
Know your limits!
Adapting your limits to reasonable values enables your CFD visualization to transfer digestible information. Now, you can see zones of high pressure – and negative pressure. All colors from the colormap are present in your picture.
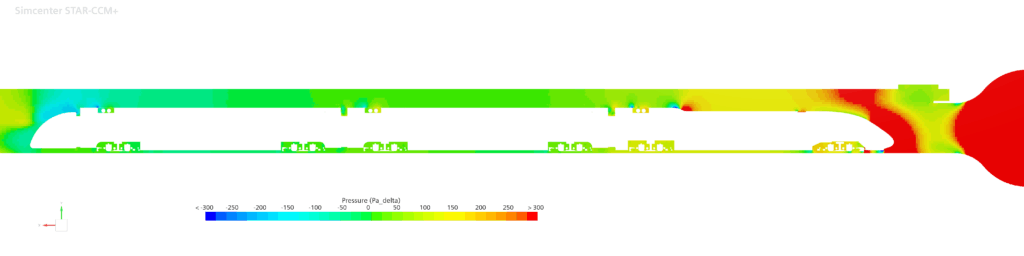
And you have wisely chosen to bring balance to the force (divided by area). Zero pressure is your reference value – and now your colormap represents this. Setting a good min and max is also very useful if you’re dealing with unsteady simulations.