Let’s be honest. Reports are boring. However, they are often necessary and can be a useful tool to prove that work is getting completed in a timely manner. But why not make them more interesting to look at and easier to read? We can do that using Excel and some SQL knowledge. In this SOLIDWORKS PDM tutorial, we discuss how to create dynamic and exciting reports.
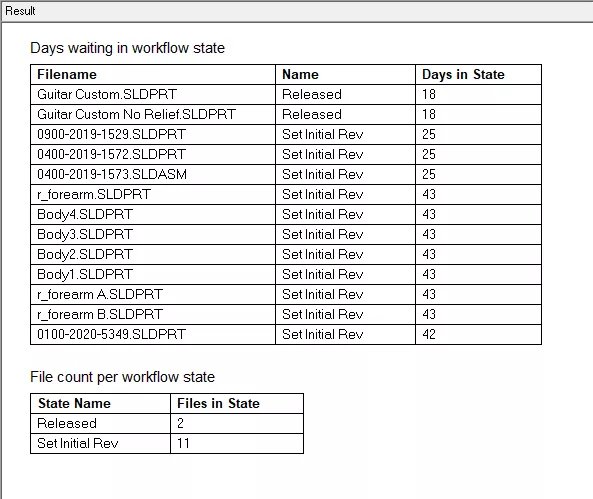
The first step is to figure out what data we want to see. Above is a PDM report retrieving the number of files that have been sitting in their workflow states since a specified date. This is all very useful information when determining where files are and what bottleneck may be in the design process.
This report was written in T-SQL and then transcribed into subtly different languages that the PDM report generator requires. Using Excel, we’ll be going back to the original T-SQL and can continue our process with any new or existing worksheet. In this case, I have a few inputs that go into these queries. These inputs are a date and a name of a workflow. We’ll do some initial setup and formatting to make the data easier to look at.

In this example are two spots with simple formating for input values. We can choose to name the cells later.
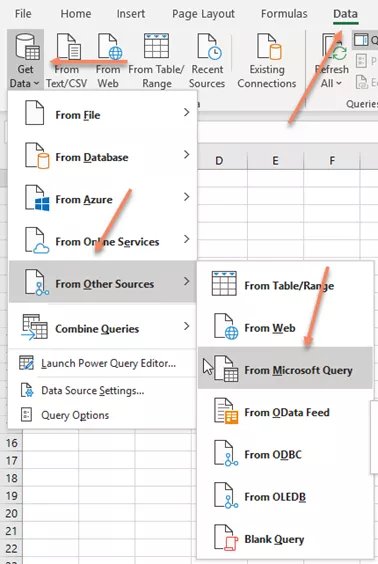
Next, we need to set up a data source for the Excel file to communicate with the SQL database. To do this, go to the Data dropdown, select From Other Source, and From Microsoft Query. We’re going to play a little bit of a trick on the Microsoft Query function in the next step to get our parameters in.
In the dialog that follows, select New Data Source, click OK, and fill in the information in the new dialog. Give your source a name and select your driver as SQL Server.
Click Connect and specify the server name, click the Options>> button to select the default database, then click the dropdown and select the database that matches your vault name.
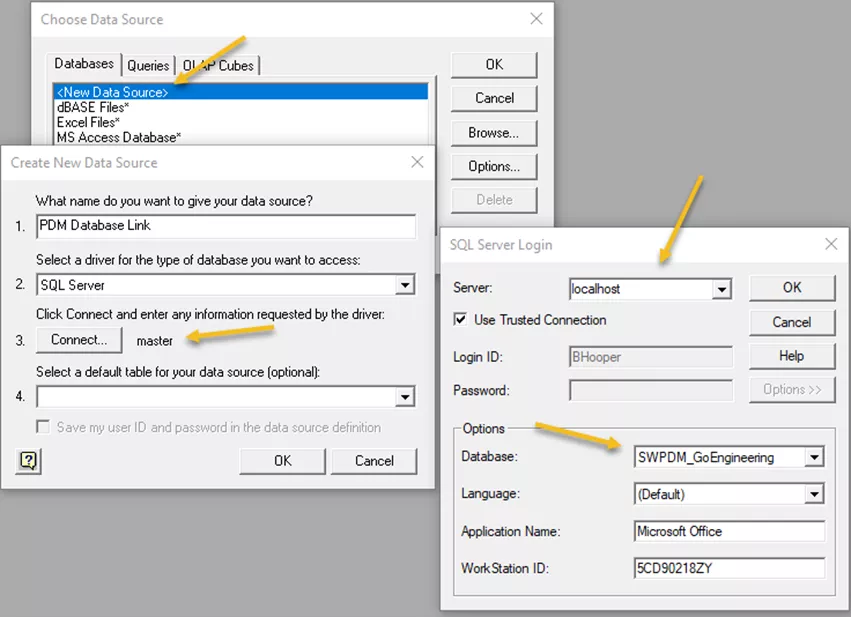
Click OK on all these dialogs to complete the data source setup. We do not need to set a default table at this time, as we will likely be pulling from several. The Microsoft Query window should then appear with the Query Wizard.
Here is where we begin our trick on Microsoft Query. The issue is that many reports are not queries that can be represented graphically according to this tool, which is a limiting factor in how we use it.
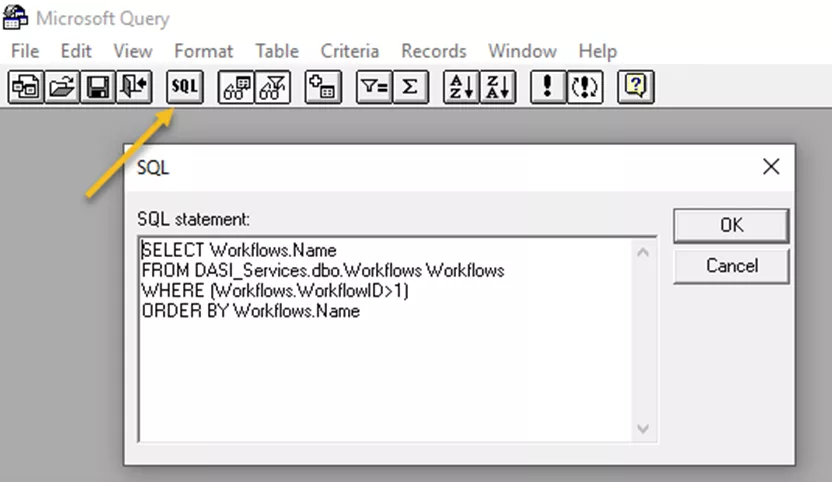
For static queries that do not require inputs this is fine. For those, click cancel on the dialog, click the SQL button on top, and input the queries. Clicking OK on the dialogs generates our query and allows us to put them on the sheet. We’ll do that in another step for some data validation purposes.
For our first queries here though, we will want to accept some inputs from the cells on the worksheet. In this case, we’ll create a very simple query, give it some inputs, and then alter it after the fact. To do this, we’ll pick a simple table and a single column of text values. In this case, the Documents table and the Filename column. Click the > button when selecting filename to move it into the query.
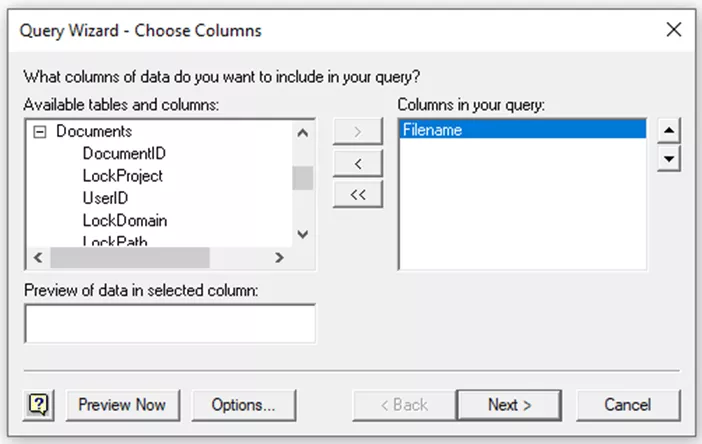
Click Next two more times to finish the dialog. In this case, we won’t need to filter or sort our data – our query will do that later. On the last page, ensure that Return Data to Microsoft Excel is selected and click Finish.
We will now get our import data dialog. We can decide how we want to display the data – in a cell range or on a new sheet. We can also decide if we want a table or a pivot table. These options are yours to select as they do not change the process and are dependent on how you want to view your information. Now click the Properties button.
At the top, give the connection a meaningful name; this will help avoid confusion later if we need to make alterations. In the Definition tab is the command text, where we should see the raw text of our T-SQL here now. We’ll be altering this directly. We need to get Excel to create some parameters for us and then prompt us for those values. We can do this by adding a WHERE clause and writing something like Filename = ?. We can do this once for each variable we want in our final query.
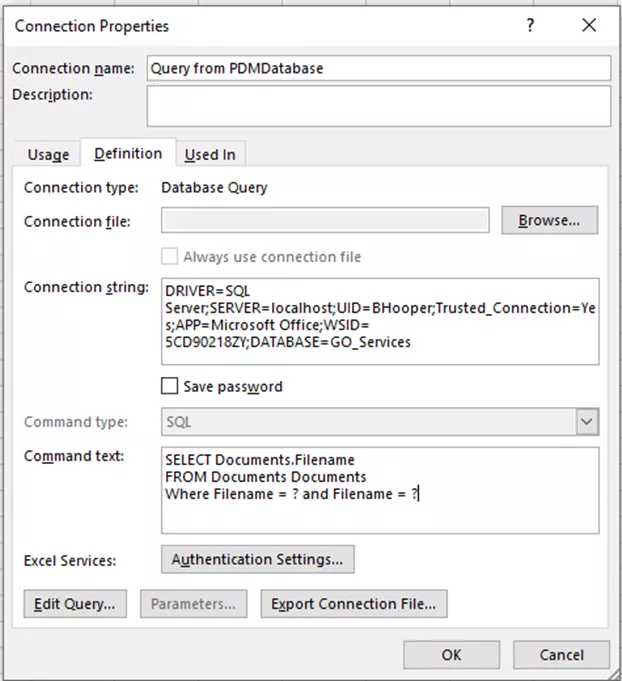
Click OK and go back to the import data dialog. Clicking OK again prompts for values. Here is where we can begin linking cells to our query. Keep in mind the order in which we select each cell for each parameter. Also, consider whether or not you want changes in this value to automatically refresh the query and if you want future refreshes to use the cell value as well. I recommend checking these boxes.
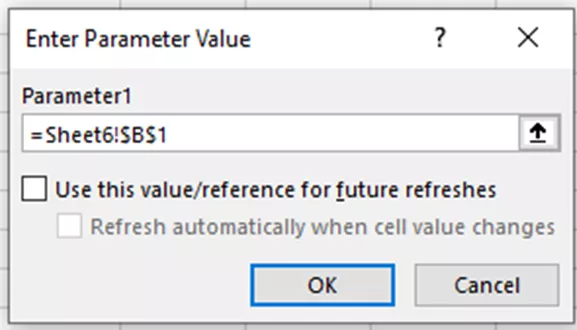
Use the picker to select the cell(s) that you set up in the first step as your inputs. Click OK for each and the query will refresh. It is likely at this point that there won’t be any values, we’ve given the report an odd query to return at this point. Let’s proceed and change that to something more useful.
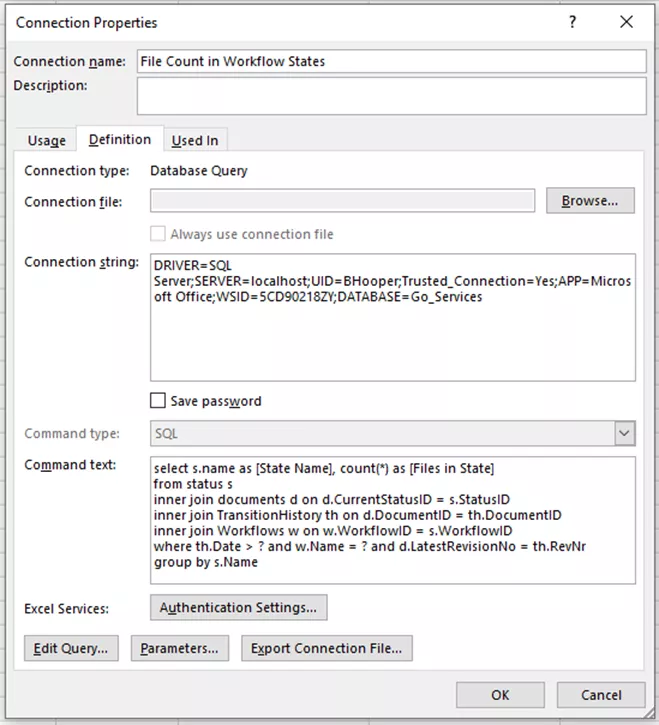
There should be a pane on the right side of Excel for Queries & Connections. If not, it can be turned on via the Data tab. This needs to be on so that we can get back into the properties of our data connection. In the pane, find the connection that was just created and RMB > Properties. A familiar dialog should appear. Go back to the Definition tab and in the command text, copy/paste the actual query you want in. For any inputs that you are taking from cells, replace those values with ‘?’. Keep in mind the original order you selected those parameter cells and order your arguments accordingly. Click OK when done.
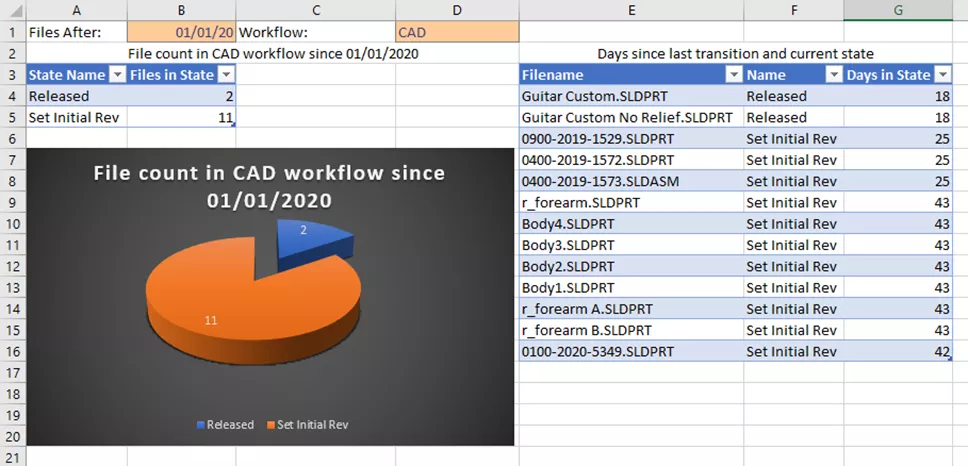
There should now be a dynamic table in the spreadsheet. Here, I have imported my data as a raw table so that I can better manipulate and work with the data. I’ve created a graph of this data to represent where all of the files in my vault have been sitting in the CAD workflow. I’ve also added a report on this same sheet for what files have been sitting in those states and for how long. This is the same information provided in the report at the top of the page but in a much easier-to-read format with dynamic inputs.
Above I mentioned the scenario that we might want to create a query that is static and fits neatly into the Microsoft Query interface. Here I’ve done this for the Workflow name selection. I don’t always remember the name of the workflow, so why not retrieve this from the database directly? We can use the steps provided above to create a query that returns our names of workflows.
I’ve set it to filter IDs of workflows that are above 1 and placed the whole report on a separate page. I then used data validation to create a dropdown in my input cell for workflow names.
Using the above methods with existing reports, we can take information and put it into charts and graphs that are easier to discuss and take action on. No more boring reports.

