After solving a study in SOLIDWORKS Simulation, exact numerical values of the result plot can be obtained from specific faces or nodes in the model using the Probe feature for post-processing. This article demonstrates how to use the Probe tool in SOLIDWORKS Simulation to see results on specific nodes or on particular faces/entities.
Probe Tool Location
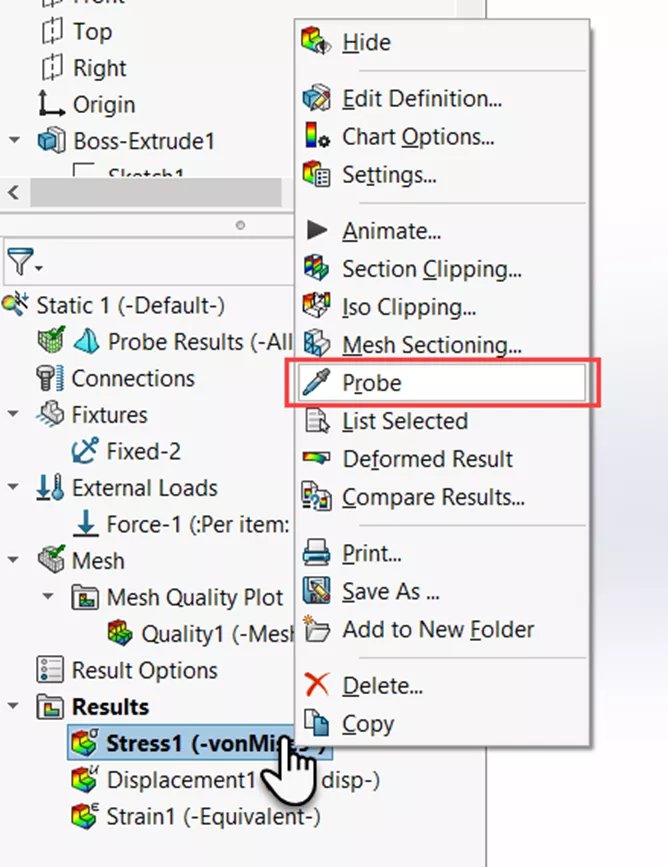
Once the study results have populated, any of the results plots can be probed to find wanted values. To start the process, right-click on the plot and select Probe.
Probe Result Options
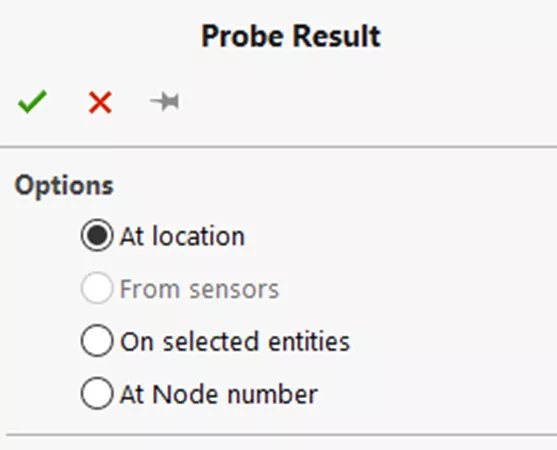
The Probe Results menu displays four options: At location, From sensors, On selected entities, and At node number.
Results and Summary
After choosing the wanted selections, the Results section displays a list of nodes, their corresponding stress values, and their X, Y, and Z locations.
Under Summary is a list of the Sum, Average, Max, Min, and RMS of the values.
Below are examples of each.
-
- At location – Select wanted nodes/points on the model in the design space.
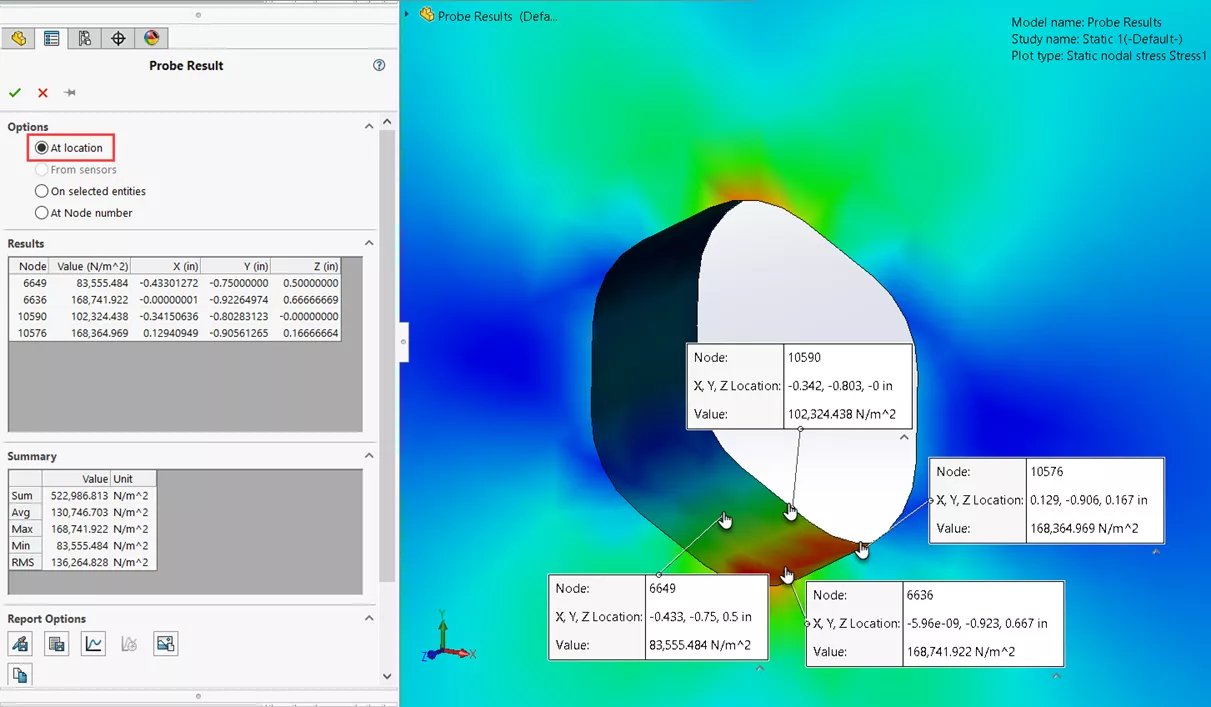
- At location – Select wanted nodes/points on the model in the design space.
-
- From sensors – Select sensors from the Sensor List (this option is greyed out until sensors are added). Sensors can be added after the study has been run. Then, when you probe the wanted result plot, the option is available and the probe results can be seen from the sensor.
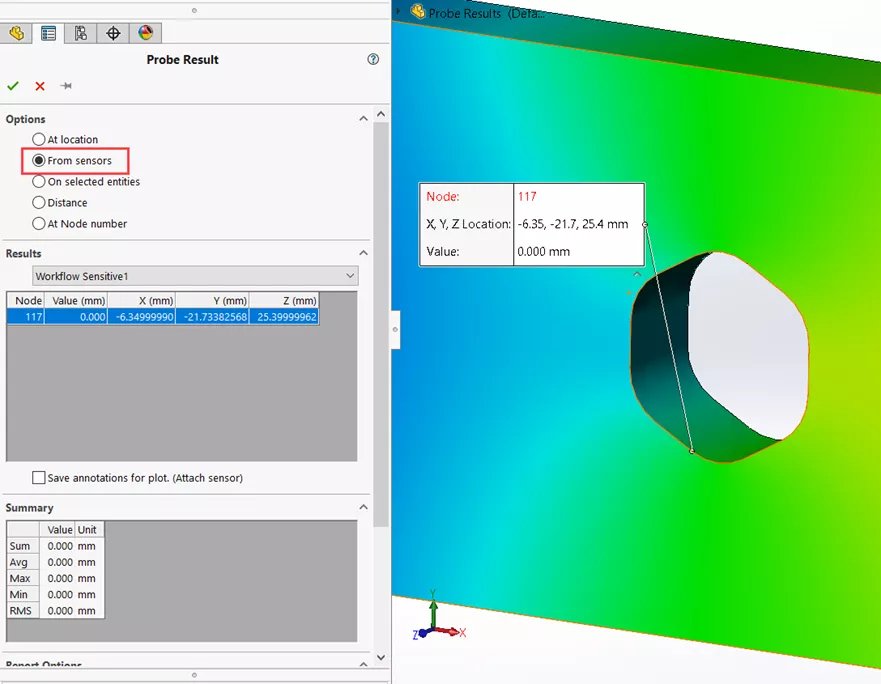
- From sensors – Select sensors from the Sensor List (this option is greyed out until sensors are added). Sensors can be added after the study has been run. Then, when you probe the wanted result plot, the option is available and the probe results can be seen from the sensor.
-
- On selected entities – Select any faces, edges, or vertices, then select Update.
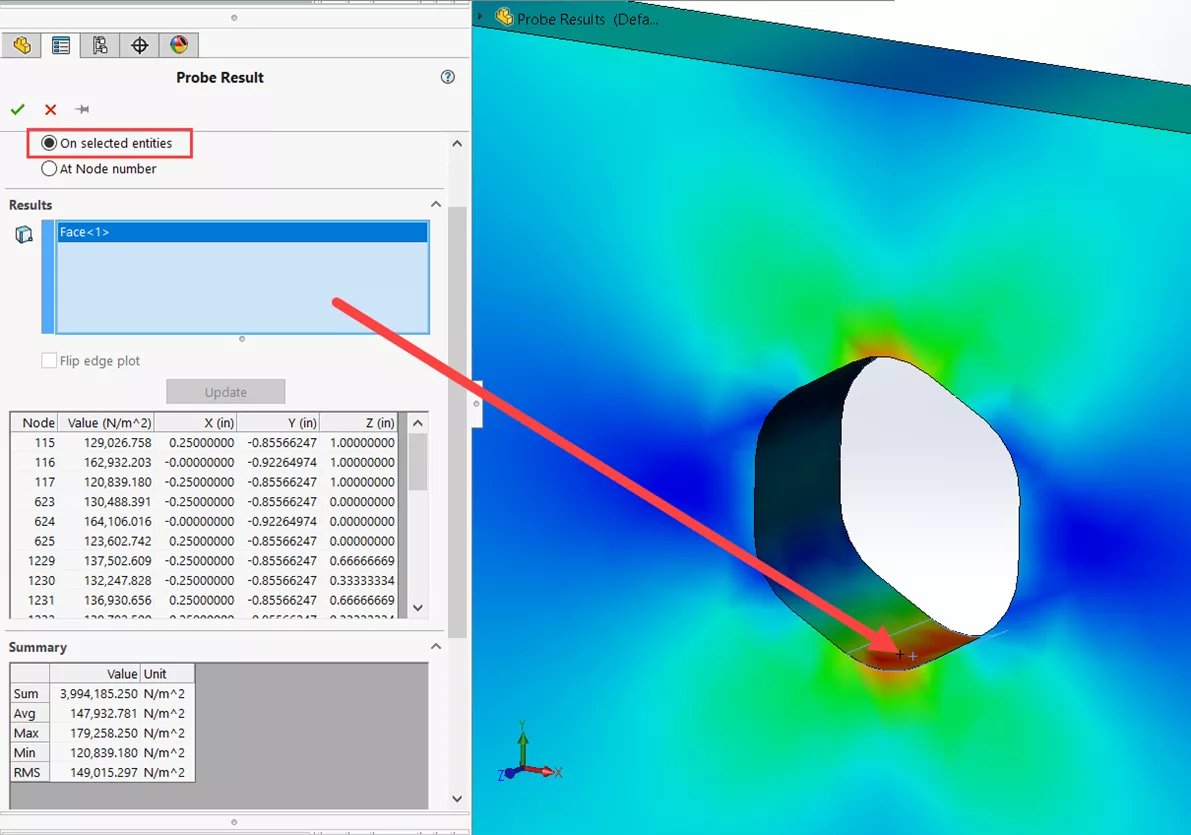
- On selected entities – Select any faces, edges, or vertices, then select Update.
-
- At node number – Input the number of the wanted node and select the Probe Result icon.
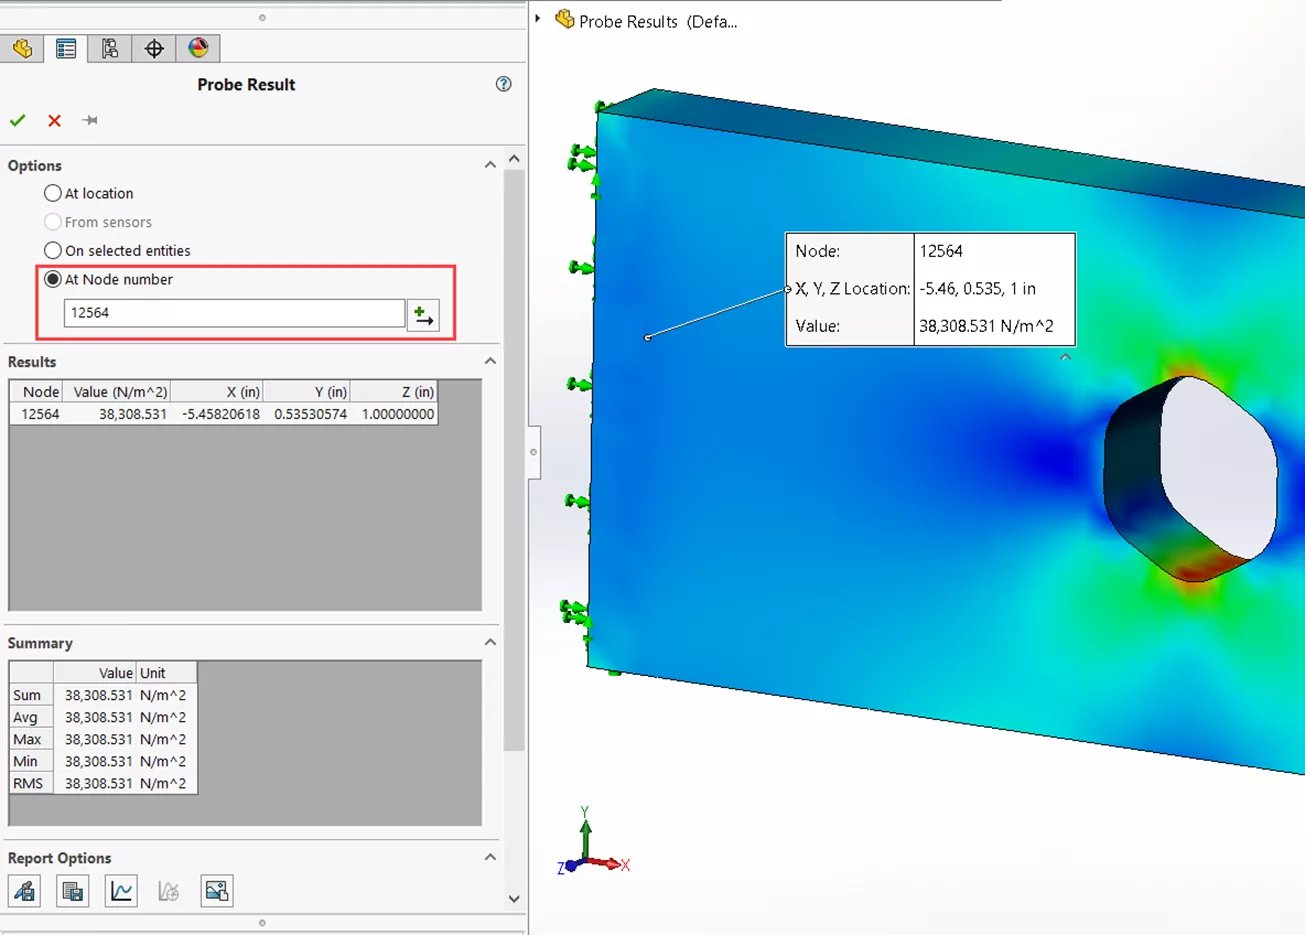
- At node number – Input the number of the wanted node and select the Probe Result icon.
report-options
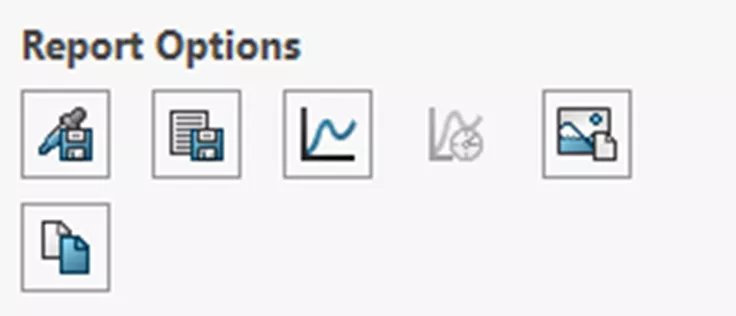
There are also a few reporting options for these probed results.
-
- Save As Sensor allows us to select any of the nodes listed under Results to create a sensor list.
-
- Save saves the probe results to a .csv file.
-
- Plot takes the results and generates a 2D graph that can be saved.
-
- Response is available for transient studies only and will graph the results vs steps.
-
- Capture Image takes a picture of the model in the design space. These can then be saved as .png, .jpg, or .bmp files.
-
- Copy to Clipboard will copy the results, to be pasted elsewhere.
Annotation Options
Select what annotations can be seen in the design space for the probed results.
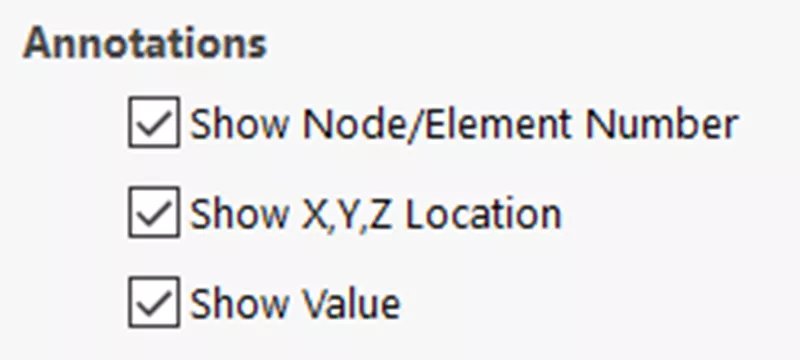
The following annotation options can be turned on or off:
-
- Show Node/Element Number
-
- Show X, Y, Z Location
-
- Show Value

